When analyzing the behavior of asset prices, market volatility is a significant component. When there is more volatility, trends alter more frequently and quickly. In times of lesser volatility, price changes occur less frequently and more slowly. Since the signals may now arrive too soon or too late, these changes have an impact on the readings of indicators. This is why it’s crucial to factor in volatility while making calculations. And I’ll be introducing the Chaikin Volatility Indicator today.
Chaikin Volatility basics
The indicator created by Marc Chaikin is a device that calculates volatility by examining the difference between an asset’s low and high prices over a given period of time. The Chaikin Volatility Indicator is what it is called (VT).
Adding the Chaikin Volatility to the Quotex chart
Open your Quotex account and log in. Choose the trading instrument you will use during this session. Configure the chart period. Choose the Volatility group of indicators by selecting the Chart Analysis icon, followed by. There will be a display of the Chaikin Volatility.
Naturally, you can also begin typing the name of the required indicator in the search box.
On a new window below your price chart, the VT will show up. It takes the shape of a line that veers off toward the 0 line.

How the Chaikin Volatility works
The indicator determines the difference between the high and low prices’ exponential moving average. Then, it calculates a percentage value representing the change in this moving average over time.
Chaikin suggests looking at volatility using a 10-day moving average.
Low readings for the indicator indicate that the intraday price range from high to low is essentially stable. The intraday price range from high to low is quite large when the indicator readings reflect high values.
When the volatility increases quickly and the price forms tops on the price chart, it is a sign that traders are becoming anxious. A developing bull market is indicated when market tops are long-term accompanied by declining volatility.

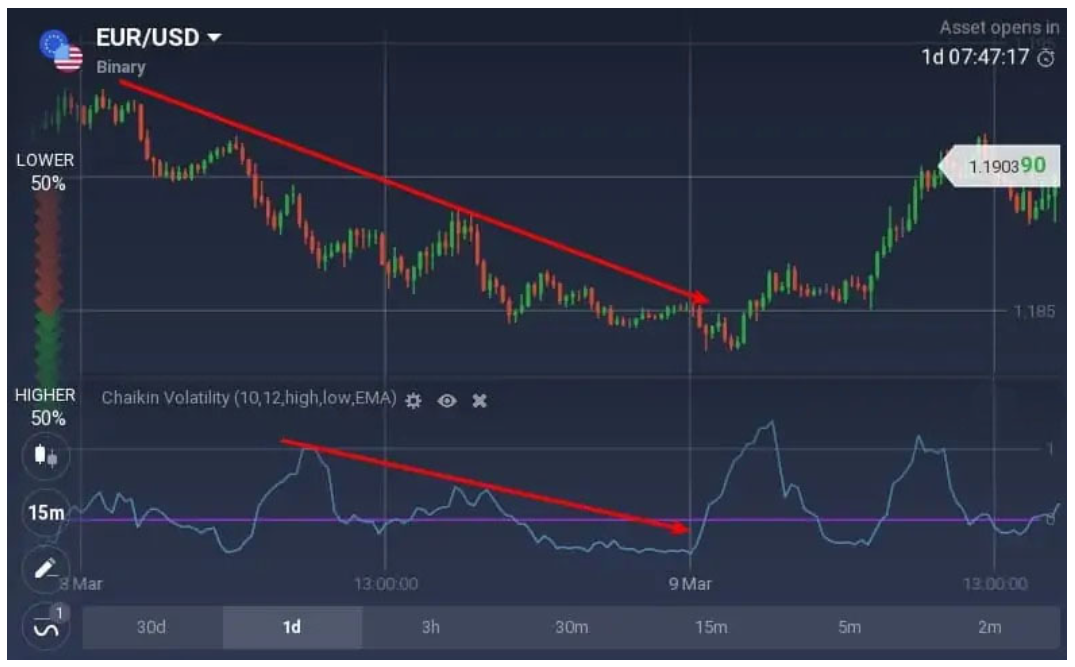
Now, it shows that traders are not particularly interested in the market when the price develops bottoms and the volatility declines over an extended period of time.

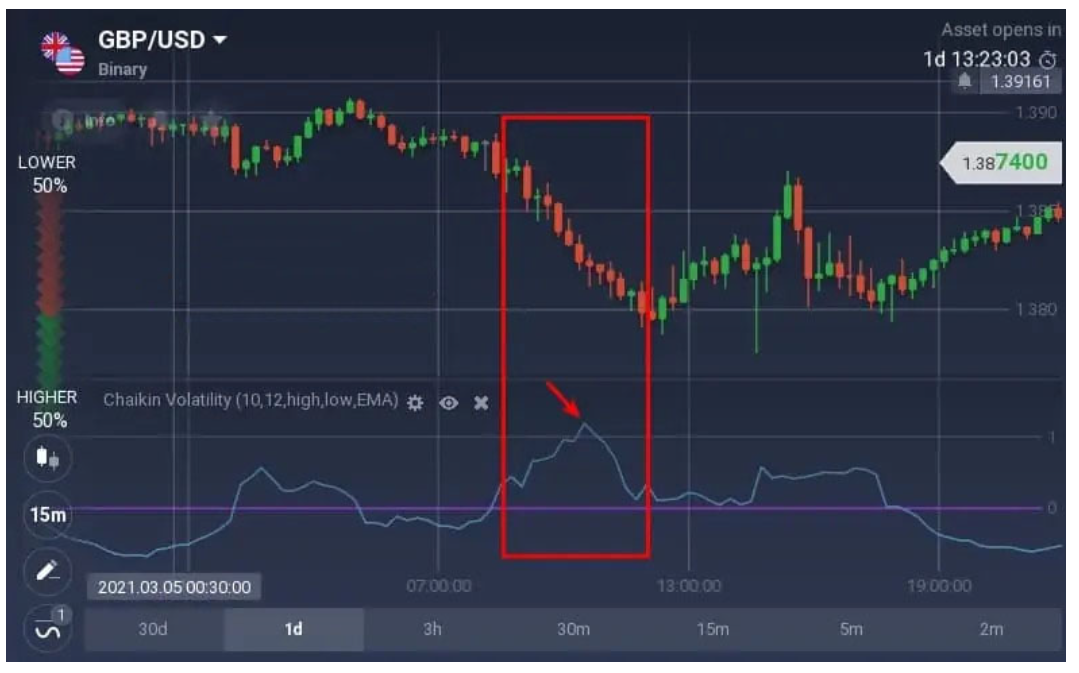
Market bottoms indicate panicked selling by traders when volatility spikes over a brief period of time.

Minimal volatility and a decline in it can be seen while prices are rising.
A modest rise in volatility may take place near the peak of the upswing, just before the trend turns.
During the downward movement, there may be seen a higher volatility.
There is an increase in short-term volatility around the bottom of the decline.
Final words
Volatility is measured by the Chaikin Volatility indicator. The 10-day moving average is suggested by the author for computations.
Visit the Quotex demo account to learn more about the Chaikin Volatility. This is a free practice account where you may test out any new trading strategies or indicators. It comes pre-loaded with virtual money that you may replenish whenever you choose. Even in the event of a failed transaction, you will not lose any of your own money. Before moving on to the real account, hone your skills.
You may read the comments section down below. Let us know what you think about the Chaikin Volatility indicator. I’d be delighted to hear from you.
FAQS
Q: What is the Chaikin Volatility oscillator on Quotex?
A: The Chaikin Volatility oscillator is a technical analysis tool that measures the volatility of an asset’s price movements.
Q: How does the Chaikin Volatility oscillator work?
A: The oscillator calculates the difference between the high and low prices of a security over a given period of time and plots the result on a graph. It is typically used to identify potential trends and trading opportunities.
Q: What are the advantages of using the Chaikin Volatility oscillator?
A: The oscillator provides valuable information about the volatility of an asset’s price movements, which can help traders make more informed decisions about when to buy and sell.
Q: How can I use the Chaikin Volatility oscillator on Quotex?
A: Quotex offers the Chaikin Volatility oscillator as a built-in tool in its trading platform. To use it, simply select the oscillator from the list of available technical indicators and adjust the settings as desired.
Q: Are there any limitations to using the Chaikin Volatility oscillator?
A: Like all technical analysis tools, the oscillator has its limitations and should not be used as the sole basis for making trading decisions. Traders should also consider other factors, such as market conditions, news events, and fundamental analysis, when making trading decisions.


