Are you looking for an effective way to trade binary options? Technical analysis may be the solution you’re looking for. In this article, we’ll explore the fundamentals of binary options technical analysis and how it can be used to improve your trading strategy.
Introduction
Binary options trading has become increasingly popular in recent years due to its simplicity and accessibility. However, like any other form of trading, it requires a sound strategy to be profitable in the long run. Technical analysis is a popular method used by traders to evaluate market trends and predict future price movements. In binary options trading, technical analysis is an essential tool for making informed trading decisions.
What is Technical Analysis?
Technical analysis is a method of evaluating market trends based on historical price data. It involves using various indicators and chart patterns to predict future price movements. Technical analysts believe that all market information is reflected in the price of an asset and that price movements follow specific patterns that can be analyzed and exploited for profit.
Key Indicators
There are several key indicators that binary options traders use to evaluate market trends. These include:
Moving Averages
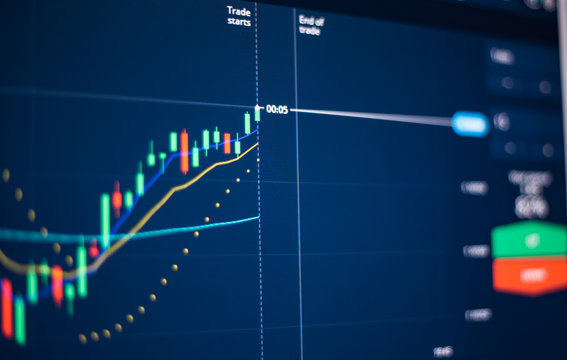
Moving averages are one of the most popular indicators used by technical analysts. They help traders identify trends by smoothing out price fluctuations over a specific period. The most common moving averages used in binary options trading are the 50-day and 200-day moving averages.
Relative Strength Index (RSI)
The RSI is a momentum indicator that measures the speed and change of price movements. It is used to determine overbought and oversold conditions in the market. A reading above 70 indicates overbought conditions, while a reading below 30 indicates oversold conditions.
Bollinger Bands
Bollinger Bands are used to measure volatility in the market. They consist of a moving average and two standard deviation lines above and below it. When the price moves outside of the standard deviation lines, it is considered a signal of a potential trend reversal.
Stochastic Oscillator
The Stochastic Oscillator is another momentum indicator used to identify overbought and oversold conditions in the market. It measures the relationship between the closing price and the price range over a specific period. A reading above 80 indicates overbought conditions, while a reading below 20 indicates oversold conditions.
Chart Patterns
In addition to indicators, technical analysts also use chart patterns to evaluate market trends. These patterns can provide valuable insights into future price movements. Some of the most common chart patterns used in binary options trading include:
Head and Shoulders
The head and shoulders pattern is a reversal pattern that indicates a potential trend reversal. It consists of three peaks, with the middle peak being the highest. Traders look for a break below the neckline to confirm a trend reversal.
Double Top/Bottom
The double top/bottom pattern is another reversal pattern that consists of two peaks or valleys. Traders look for a break below the support level to confirm a trend reversal.
Triangle
The triangle pattern is a continuation pattern that indicates a potential trend continuation. It consists of two trend lines that converge towards a point. Traders look for a breakout above or below the trend lines to confirm a trend continuation.
Putting it All Together
To effectively use technical analysis in binary options trading, it is essential to combine various indicators and chart patterns to identify profitable trading opportunities. Traders should also consider other factors such as economic news, market sentiment, and geopolitical events that may affect the price of an asset.
Conclusion
In conclusion, technical analysis is a valuable tool for binary options traders looking to make informed trading decisions. By using various indicators and chart patterns, traders can evaluate market trends and predict future price movements. However, it is essential to combine technical analysis with other factors to develop a sound trading.
FAQs
- Is technical analysis the only method for trading binary options?
No, there are other methods such as fundamental analysis and sentiment analysis. However, technical analysis is a popular and effective method for evaluating market trends.
- Can technical analysis be used for short-term and long-term trading?
Yes, technical analysis can be used for both short-term and long-term trading. However, the time frame used for analysis may vary depending on the trading strategy.
- Do I need to be an expert in technical analysis to trade binary options?
No, you don’t need to be an expert in technical analysis to trade binary options. However, it is important to have a basic understanding of key indicators and chart patterns.
- How often should I review my technical analysis strategy?
It is recommended to review your technical analysis strategy regularly to ensure that it is still effective in current market conditions.
- Can technical analysis be used for all types of assets in binary options trading?
Yes, technical analysis can be used for all types of assets including stocks, currencies, commodities, and indices. However, different assets may require different indicators and chart patterns for analysis.


