One of the most crucial abilities a trader must have is the ability to recognize support and resistance levels. Understanding how the price responds as it approaches the support or resistance is made possible by this ability. Knowing the optimal locations to enter or quit an open position is made simpler as a result.
Sometimes the price will reach the support or resistance before turning around. In other cases, it will pass through the levels of support or resistance. This lesson explains how to spot price attempts to break resistance or support. It also instructs you on what to do in a similar situation.
How do you know when the price is about to break through the support or resistance?
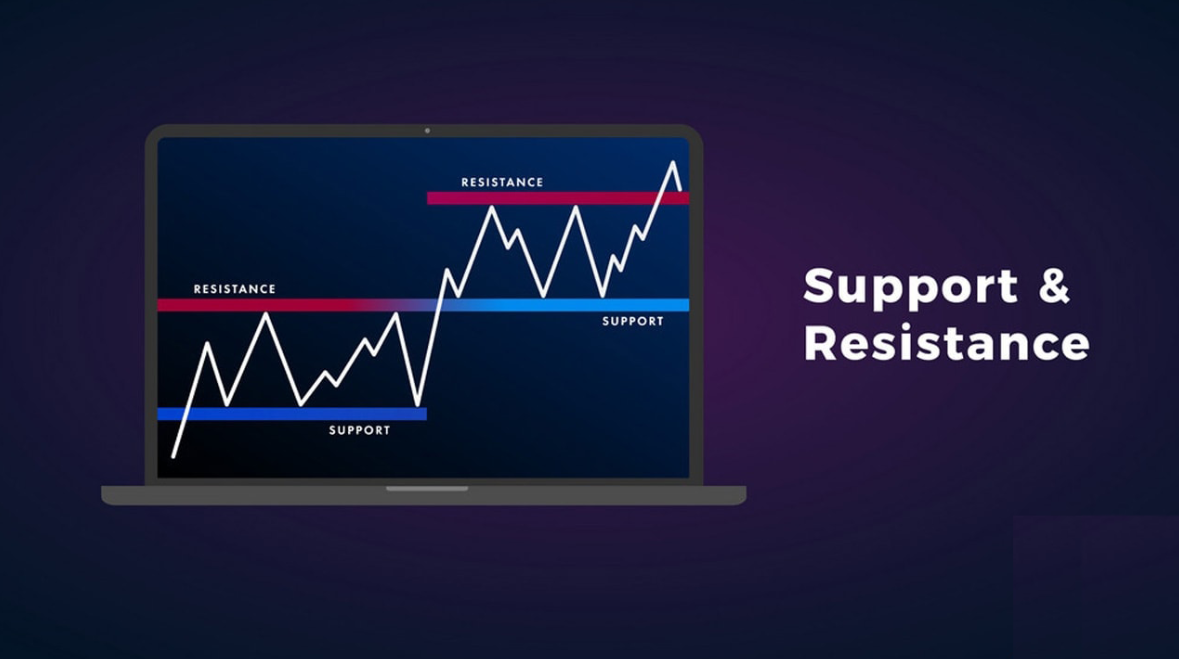
You must be aware of the terms support and resistance levels. Nevertheless, just in case you’re unaware, these are the price ranges between which prices appear to fluctuate. In other words, prices don’t appear to consistently rise or fall above or below certain levels. Support and Resistance, the two most important technical indicators for Quotex traders, will be covered in-depth in this book.

As an asset’s price changes over time, it typically finds a price point where it recovers. This is the resistance or support. At the lower price point, support develops, and at the higher price point, resistance does. There are either weak or strong degrees of support and resistance.
The quantity of times the price has struck a support or resistance level before rebounding back serves as a gauge of the level’s strength. The price has repeatedly reached strong support and resistance levels during a given time frame. A support or resistance level is seen as weak if price only touches it once before breaking through. For the price to pass through a significant support/resistance level, the price momentum must be rather strong.
How to know if price momentum is strong enough to break through support/resistance
To begin with, you should determine the dominant trend using a candles chart. If it’s a strong one, you’ll note that the candles are forming larger and more frequently, with two or more consecutive candles of the same hue.
In addition, you can anticipate a news or economic event to strengthen the price momentum. Prices will move in a specific direction shortly after the news is released, frequently breaking through the support and resistance levels.
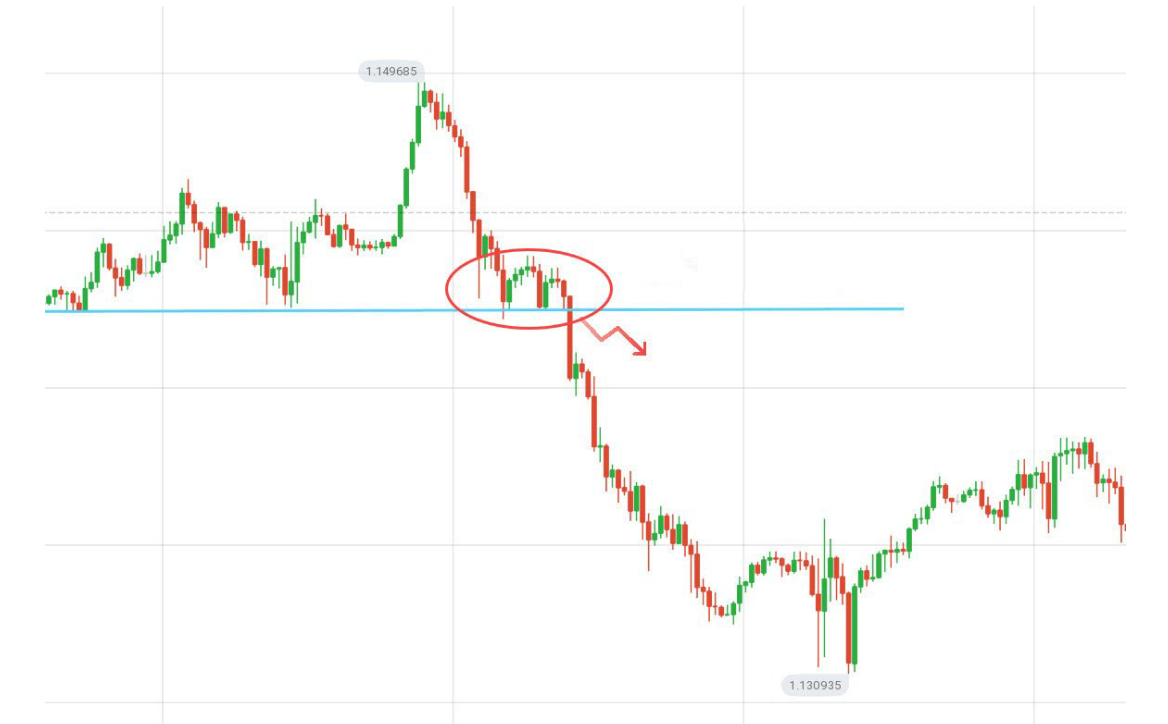
Occasionally, the price consolidates just before it encounters the support or resistance. In other words, the price fluctuates within a small range. The price has built up enough momentum to break through as it gets closer to the support/resistance level. Yet, before finally breaking through, the price frequently reverts to the range.
Heres an example:

Avoiding false breakouts
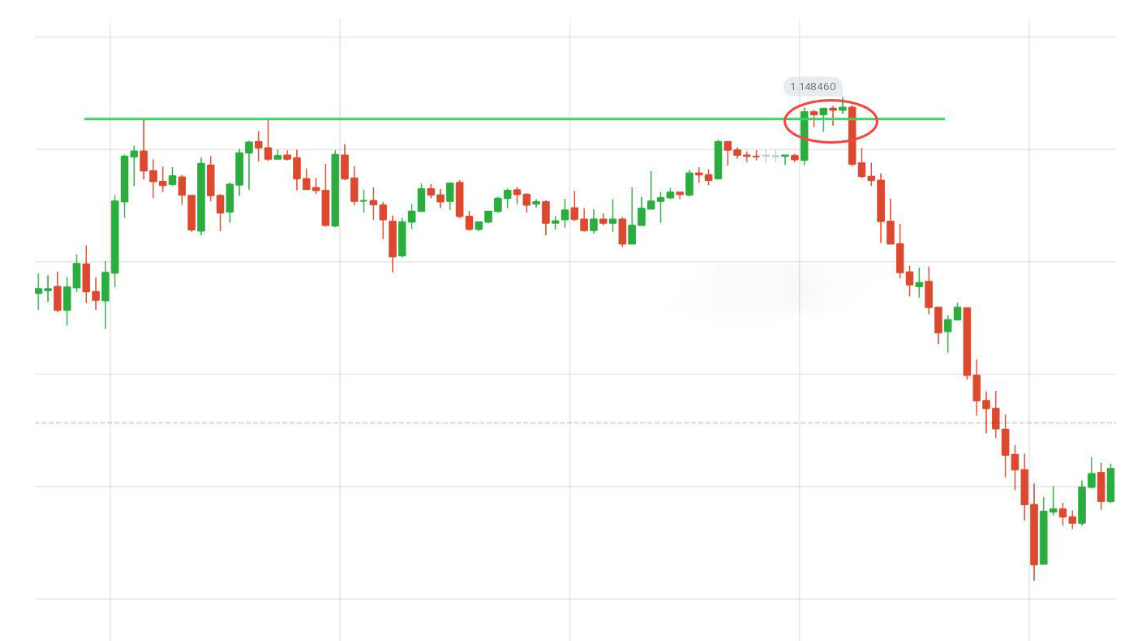
False breakouts happen when the price leaves the support/resistance zone but returns to it very quickly before the trend changes. Most traders lose money on false breakouts.
Examining how the price reacts when it encounters a strong support or resistance level might help traders avoid false breakouts. What kind of trend emerges, then?
You can see from the photo below that when prices encounter the resistance, a downtrend will emerge. When the price breaks the resistance and stays above it, this is known as a fake breakout.
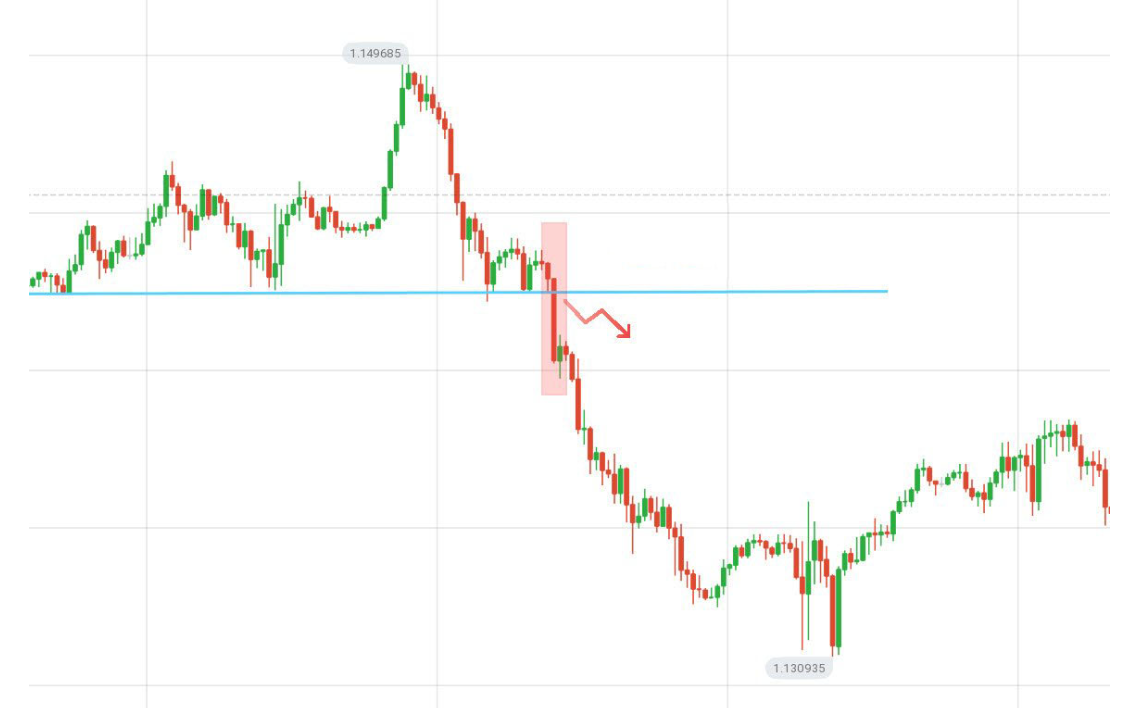
Then, a solid bear candle breaks the support indicating a downtrend. This is where you should enter your trade.

What action should you take once the price breaks the support/resistance on Quotex?
You can anticipate that the trend will stay in the same direction if the price crosses over a thin support or resistance. Consider how the price responds when it reaches a strong support or resistance level.
If you look at our picture from before, you can see that the price typically goes down. Wait until the markets act as they did when prices hit the support/resistance levels if the breakout occurs. Based on the evolving trend, that is the best time to enter the trade.
What causes false breakouts? Traders that enter the market when it is already stretched and poised for a reversal tend to cause false breakouts. It’s likely that many traders in the aforementioned case believed the trend would increase.
Yet, experienced traders are aware that waiting until markets act as they did when prices brushed the high resistance level is a bad idea. When this occurred, the downward trend started indicating that it was time to start selling.
Enter trades based on price trends to protect against false breakouts
As I previously stated, understanding how price acts when it reaches a support or resistance gives you a sense of how to trade when it does so again.
So, it’s crucial to read your chart. Typically, I advise you to trade on a chart with a longer time frame than your trading sessions. For instance, you should examine the 30-minute or 3-hour chart if you trade 5 minute candles.

price breaks the support and a downtrend develops
Sometimes the price repeatedly breaks through the levels of support and resistance. To assist you in choosing the ideal time to place your trades, you can use extra tools and indicators.
The Quotex Bollinger Bands indicator is one practical tool. This indication can be used in a variety of ways. For instance, this is a hint to trade short when price begins to decline and breaks the lower band before approaching the support/resistance zone.
Support/resistance trading is a skill that takes a lot of perseverance and effort to master. Once the price breaks through the support or resistance, your goal should be to determine the best trading entry position.
Open a practice account on Quotex right away to begin trading if you want to put these skills to use.
You can only learn how to recognize support and resistance levels and tell when prices are going to breach them by doing this.


