
The optimal times to enter trading positions are frequently determined by traders using divergence. What are they, what kinds of divergences are there, and how can you trade with them? Today’s essay will provide the answers to these queries.
Two types of divergences
When there is a discrepancy between the movement of a certain oscillator and the movement of the price of the underlying asset, we might discuss a divergence. The Stochastic Oscillator, Moving Average Convergence Divergence, Relative Strength Index, and Commodity Channel Index are a few examples of tools you can use.
Divergences can be classified into two main categories. concealed divergence as well as regular divergence.
A few words about a regular divergence
The price is always fluctuating. Sometimes it causes lower lows or higher highs. We can discuss divergence when this occurs on the price chart but the indicator line is not displaying the same thing.
A stark contrast between price action and indicator movement indicates that the present trend is waning and that a reversal is imminent.
Nonetheless, it might be challenging to predict exactly when something like this would occur. Use of other tools, such as trendlines, candlestick and chart patterns, may therefore be a smart idea.
The bullish and the bearish divergence
Depending on the direction, classic divergence could be bullish or bearish (negative). Below is a picture showing a perfect bearish divergence on the USD/JPY.
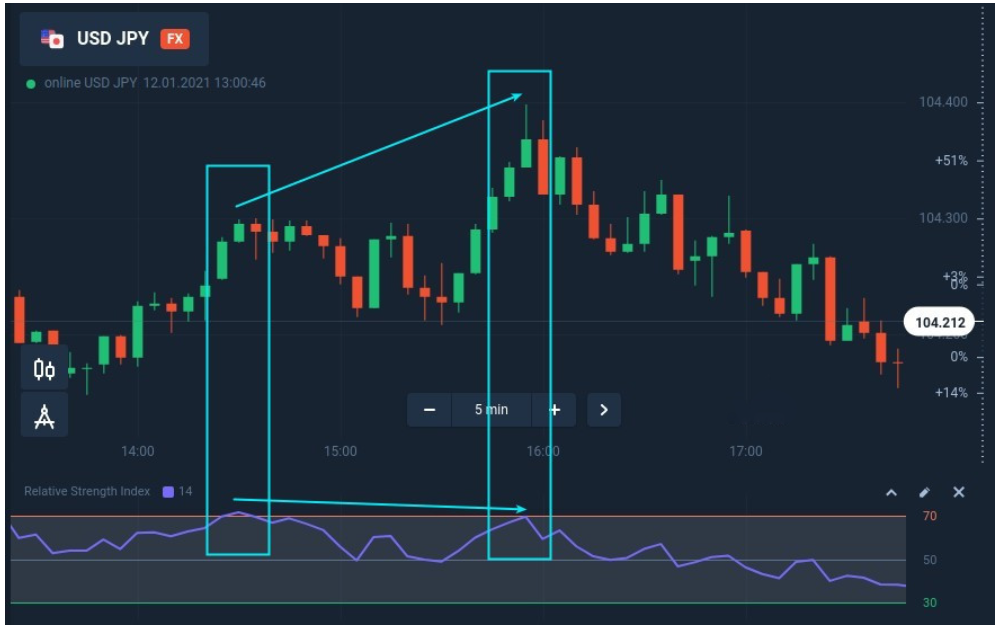
The downtrend is when the bullish divergence emerges. Although the oscillator does not support the same behavior, the price makes lower lows. Instead, it creates higher lows, double bottoms, or triple bottoms. The latter happens more frequently when utilizing the Stochastic Oscillator or the RSI and is less relevant than the higher lows.
While the price is on an upswing, a bearish or negative divergence emerges. There are higher highs reached by price action that are not supported by indicator movement. Lower highs, double tops, or triple tops could be produced by the oscillator.
What is a hidden divergence?
When the oscillating indicator makes a lower low or higher high and the price movement doesn’t appear to follow suit, we can state that a hidden divergence has occurred.
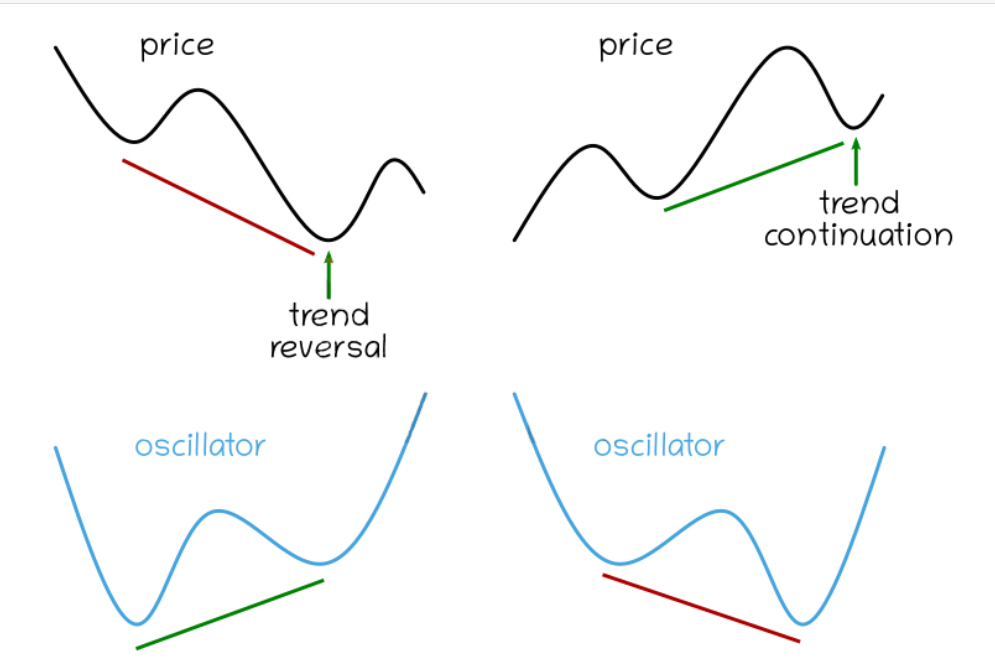
Such a scenario can arise when the price is settling or correcting within the present trend. Given that it indicates that the trend will likely move in the same direction, a hidden divergence is a continuation pattern. So, you can trade with a trend by using hidden divergences. Pullbacks with hidden divergences are simple to spot.
The bullish and the bearish divergence
Similar to the traditional divergence, the hidden divergence has two types. The first is a bullish divergence, while the second is a bearish one.
When the indicator makes lower lows during an uptrend and the price does not, the bullish divergence is present. It indicates that the price is in a phase of consolidation or correction and that the trend will shortly continue in that direction.
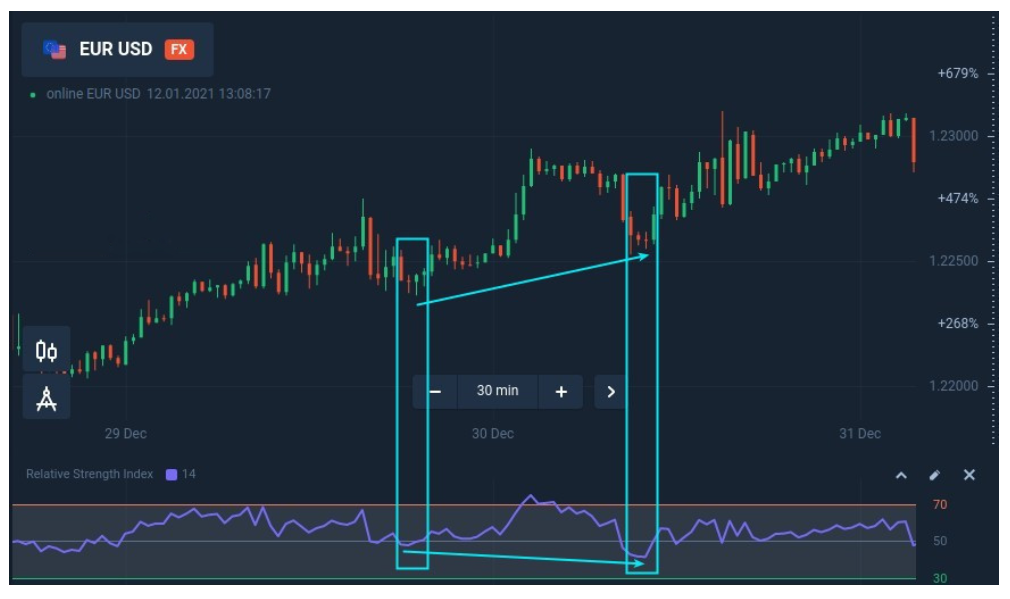
A decline may experience the bearish divergence. While the price action does not display greater highs, the oscillator does. The downward trend is anticipated to continue shortly.

Trading with the divergences on the Quotex platform
Divergences by themselves do not provide clear signs to open a trade in the market. Yet, they provide crucial data regarding the price’s future trajectory. The continuation of the trend is predicted by a concealed divergence as opposed to a conventional divergence.
To determine the ideal entrance point for your transaction, you will need to employ an additional strategy. Simple examples include the trendline, the crossing of moving averages, or several candlestick patterns. Divergences can also be used in conjunction with Bollinger Bands or trading envelopes.
Around the resistance trendline and when a bearish reversal pattern emerges during the uptrend, the bearish divergence becomes more significance.
When a bullish reversal pattern develops during a downtrend and close to the support trendline, the bullish divergence is more noteworthy.
Summary
Divergence is a discrepancy between price movement and oscillating indicator movement. A divergence occurs when one is decreasing or rising while the other is not.
Divergences can be classified as either regular or concealed. The initial ones provide information regarding a potential change in trend direction. The concealed divergences indicate that, following a correction or brief consolidation, the trend will likely resume its trajectory.
Depending on whether they occur during the upswing or downtrend, both categories can be bullish or bearish.
Use an extra tool to find your entry point.
Utilize a free Quotex demo account to practice identifying divergences. If you want to make money in a genuine trading account, you must be prepared and self-assured.
Have you ever used divergences in your trading? Can you tell which type is which on the price chart? Inform us in the site’s comments section, which is located further down.
- What is a pullback?
A pullback is a temporary reversal of the current trend. It occurs when the price retraces or “pulls back” to a previous level of support or resistance before continuing in the direction of the trend. - What is hidden divergence?
Hidden divergence is a technical analysis tool used to identify a potential trend reversal. It occurs when the price is making lower lows while the indicator, such as the RSI, is making higher lows in a downtrend, or when the price is making higher highs while the indicator is making lower highs in an uptrend. - How can I identify pullbacks and hidden divergence on Quotex?
To identify pullbacks on Quotex, look for a temporary reversal of the current trend that retraces to a previous level of support or resistance. To identify hidden divergence, compare the direction of the price movement with the direction of the indicator movement. Look for the indicator to move in the opposite direction of the price movement, indicating a potential trend reversal. - What are some common trading strategies for trading pullbacks with hidden divergence on Quotex?
One common trading strategy for trading pullbacks with hidden divergence is to wait for the price to pull back to a key level of support or resistance and then enter a trade in the direction of the trend, using the hidden divergence as a confirmation signal. Another strategy is to use a trailing stop-loss to protect profits. - What are some risks associated with trading pullbacks with hidden divergence on Quotex?
One risk associated with trading pullbacks with hidden divergence is that false signals can occur, resulting in losses. It is important to use risk management techniques such as stop-loss orders to minimize potential losses. - Can I use other technical indicators in conjunction with pullbacks and hidden divergence on Quotex?
Yes, you can use other technical indicators in conjunction with pullbacks and hidden divergence on Quotex. It is important to choose indicators that complement each other and provide different types of information about the market. - How can I improve my ability to identify and trade pullbacks with hidden divergence on Quotex? To improve your ability to identify and trade pullbacks with hidden divergence on Quotex, it is important to practice and gain experience, and to stay informed about market news and events that may impact trading. You can also use demo trading accounts to practice your strategies without risking real money.


, Bank (Banco BCI, Banco TBanc, Santander, Banco Walmart – Lider, Banco Walmart – aCuenta, Express Lider), E-payments and Cryptocurrencies")


