
The primary responsibility of a trader is to watch price changes and then initiate a deal in response to these observations. The situation is usually pretty evident when a strong trend is seen on the price chart. In other occasions, though, the progress is sluggish or the price stabilizes. To cope with them, one strategy is to look for divergences. Many people are unsure about how to respond in these situations. The topic of today’s post is this.
What is the divergence?
You must utilize specialized oscillator-based technical analysis tools in order to recognize the divergence. On the Quotex platform, there are a handful that you can pick from. They will somewhat diverge. Yet, the fundamental guidelines stay the same.
When it comes to spotting the trend, a trader has a few options. He only needs to create a trend line. He is also capable of making judgments by analyzing numerous time periods. He can also make use of a moving average. The trend may be robust or feeble. Utilizing a convergence, we can determine its strength.
When a specific oscillator and the price are rising or decreasing simultaneously, convergence occurs. Both the price and the oscillator may hit a high during an uptrend and then hit another that is higher than the prior one. They may create a low during the downtrend, followed by another that is lower than the previous one.
Divergence is the result of only the price making a higher high and the oscillator making a lower high during an uptrend. Similar situations occur when the oscillator makes a higher low during a downtrend while the price forms a lower low. You might infer that the trend is waning and will most likely change direction soon.
Some of the oscillators offered by Quotex
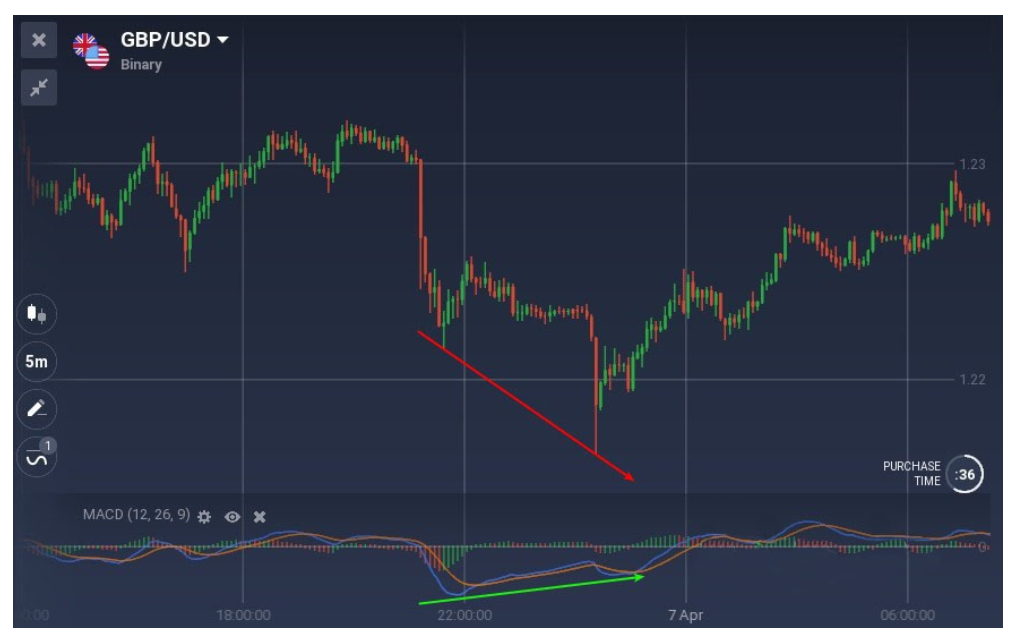
To detect divergence, you can use a variety of oscillators. The Moving Average Convergence Divergence is one of them (MACD). Below is an example chart that uses the MACD. Although the MACD is rising and making a higher low, the price is falling and making a lower low. It can be interpreted as an indication that the trend is about to change.
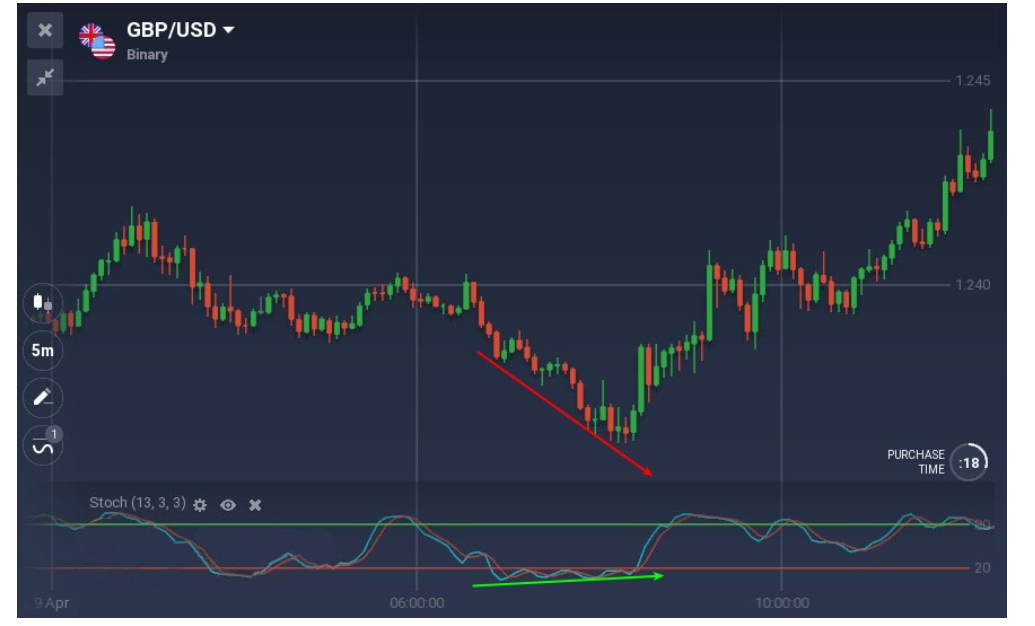
Another type of oscillator you might use is the stochastic oscillator. A decline may be seen once more on the chart below. However, just the price is falling. Stochastic is increasing. The pattern will shortly change.
Best entry points when trading with the divergence
Many traders believe that the signals derived from divergences are insufficiently strong. They contend that before the trend actually reverses, the oscillator may exhibit divergence for a considerable amount of time. The dilemma then becomes when to start a transaction.
You should use price action strategies and stick to candlestick patterns in order to discover the best entry points with divergences. For instance, you might look for a pin bar at the peak of an uptrend or the trough of a downtrend and place your trade immediately after it.
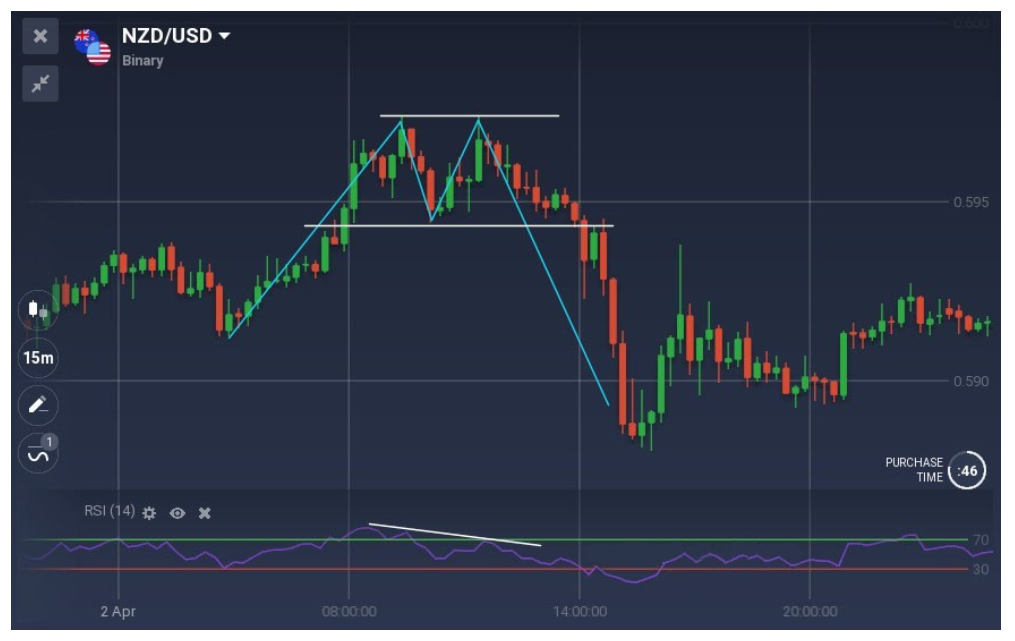
Another oscillator that might be quite useful in identifying the divergence is the Relative Strength Index (RSI). Check out the graph below. The divergence is visible on the RSI. Watch the price bars now. The pattern of a double top has emerged. It provides you with confirmation that now is a suitable time to start the trade.
Summary
The oscillators aid in the detection of a divergence. It doesn’t always happen that there will be a divergence. Finding it can occasionally be a challenge. Yet, once it is apparent, you may anticipate that the tendency will soon change. Use additional strategies, such as candlestick pattern recognition, to determine the optimum entry points.
A practice account is provided by Quotex. You paid nothing to access it. Additionally, it is continually refilled with virtual money, making all of your transactions there risk-free. This is the ideal situation to practice spotting divergences and locating the points of entry for your profitable deals.
Inform us about your encounters with the divergences in the comments section below. I look forward to hearing from you.
FAQS:


, Bank (Banco BCI, Banco TBanc, Santander, Banco Walmart – Lider, Banco Walmart – aCuenta, Express Lider), E-payments and Cryptocurrencies")


